Java Flight Recording / Cryostat and OpenShift
Published on 10/07/2022
5 min read
In category
development
Java and JVM performance monitoring and application profiling is essential not only for critical production workload. JDK Flight Recorder (JFR) and JDK Mission Control are the established solutions here. This article covers the Kubernetes/OpenShift solution Cryostat to bridge the gap to JVM applications in a Kubernetes runtime.
Overview
Since OpenJDK 11 is JDK Flight Recorder (JFR) released as proper Open Source component. Before that it was a commercial feature in the Oracle JDK. JFR, as a profiling solution, collects all the JVM internal metrics/events and - if available - also custom events. Those data are stored internally in very efficient binary format. Since JDK 14 the events can also be streamed via API. JDK Mission Control is the regular tool for the analysis.
JFR uses Java Management Extensions (JMX) to interact and retrieve all the state details from the observed application. This includes the various internal details of the JVM like thread and memory state, garbage collection activities, allocation of objects, file and socket I/O, exceptions etc.
Through containerization and Kubernetes runtimes, one would also like to have the possibility to analyse and profile JVM related workload in a Kubernetes runtime. Usually, one does not want to expose the JMX endpoints to the outside world, so that the profiling tools can gather the events. The obvious conclusion is that the profiling tool (here: JFR) is provided and deployed in the same Kubernetes environment. And this is where Cryostat steps in. Cryostat enables the event gathering (recording) of containerized Java workload and supporting Kubernetes and OpenShift.
In the next section we will cover the minimal steps to record and profile a Java application in an OpenShift cluster with Cryostat.
Preparation
The preparation includes only the installation of the Cryostat Operator. In OpenShift is this simple installation from the OperatorHub
- Search for
Cryostat - Install in a new namespace
- Afterwards create an instance (default values are totally fine)
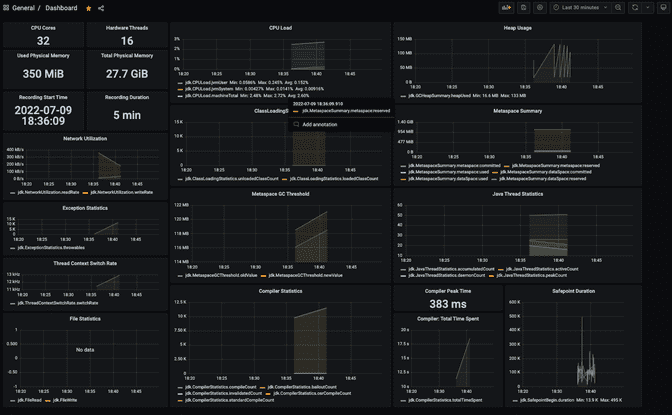
This results in a Cryostat instance with route to the UI and Grafana instance, where Cyrostat upload a subset of the recorded events.
Info: Grafana is protected and credentials are in a
Secret, see for details in the usage instruction
Record
To record the events from a running Java containerized application are the following points necessary
- The application should expose an JMX endpoint
- Cryostat has to discover this application and endpoint
In case a Quarkus application is used, is JMX in the JVM-mode always enabled. Here are only the right environment variables necessary to expose the endpoints in the Kubernetes Deployment
env:
  - name: JAVA_OPTS_APPEND
    value: >-
    -Dcom.sun.management.jmxremote
    -Dcom.sun.management.jmxremote.port=9998
    -Dcom.sun.management.jmxremote.rmi.port=9998
    -Djava.rmi.server.hostname=quarkus-playground-s2i.demo-jfr
    -Dcom.sun.management.jmxremote.authenticate=false
    -Dcom.sun.management.jmxremote.ssl=false
    -Dcom.sun.management.jmxremote.local.only=false
Consider the following configurations
- define a port for JMX and use this also in the Kubernetes
Servicedefinition of the application - define the hostname with
<service-name>.<namespace>. The communication between Cryostat and the app stays inside the cluster, so no (external) IP is here needed
As mentioned above the Service should contains the JMX port
ports:
    #...
    - port: 9998
      targetPort: 9998
      protocol: TCP
      name: jfr-jmx
Consider here, that the JMX port contains the name jfr-jmx. This is the name, that Cryostat expects. This is helpful, in case Cryostat is running in the same namespace as the application/container. In this case, Cryostat would discovers this new target application automatically.
Usually, Cryostat is running in an own namespace or should record various applications in different namespaces. For that reason, one have to register the target applications manually via the Cryostat UI using this URL format as example
service:jmx:rmi:///jndi/rmi://quarkus-playground-s2i.demo-jfr:9998/jmxrmi
Same here, for Service name and namespace to reach the JMX endpoint of the application.
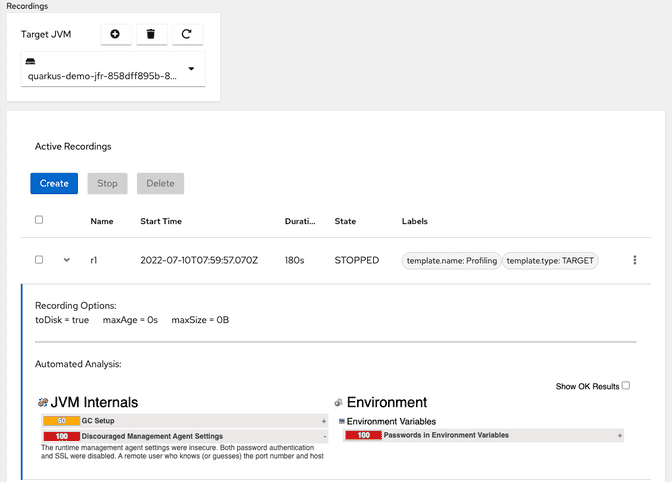
After selecting the Target JVM in the Cryostat UI and Recording tab, one have the option to define the duration of the recording and the detail level.
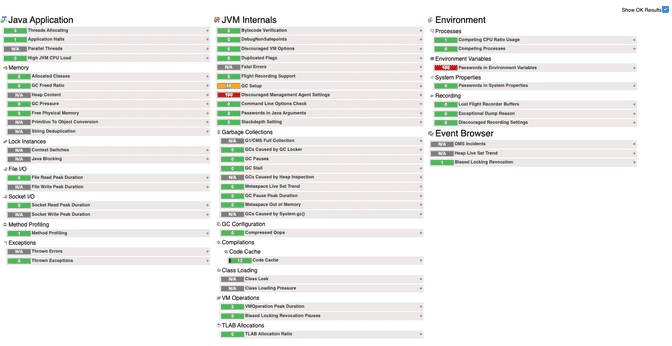
After the recording provides Cryostat a short Analysis report with the main pain points. Details are in the context menu of the recording like a link to Grafana, HTML report or the option to download the JFR file.
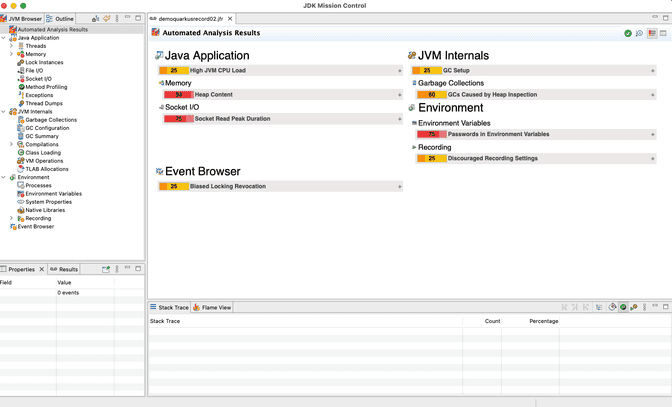
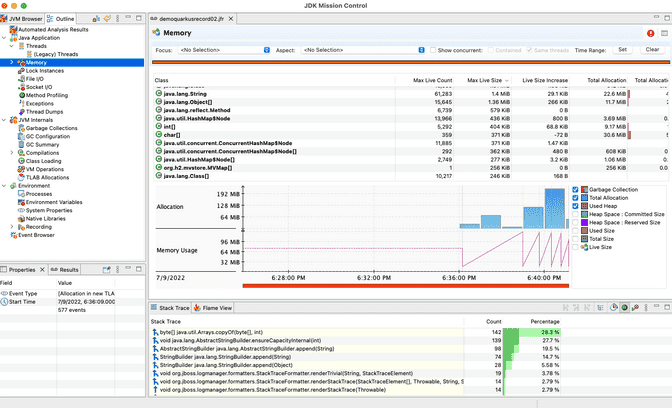
A more comprehensive analysis can be carried out with JDK Mission control. For this, the recording file (.jfr) only has to be imported.
Outlook
JDK Flight Recorder (JFR) and JDK Mission Control are not really new. But Cryostat still is to some extent. Red Hat and the community is still improving and increasing the feature set like
- GraalVM Native Image support
- Better integration in OpenShift like RBAC/OAuth support
- Determine workload via labels and automated rules etc
- or asserting JFR events with JfrUnit
Summary
The mature profiling solution JDK Flight Recorder (JFR) and because of its minimal overhead, it is ideal to use it in productive environments. And because of Cryostat, this can also be done in an OpenShift environment.
This all enables a more transparent environment through the option and capability to simply analyse JVM containerized applications. Memory leaks - bye bye.
In the quarkus-playground project are the relevant configuration integrated.
